openEO
Variability maps
Variability Map
Variability maps show the spatial variation in crop performance within a field on a given date. These variations can stem from differences in soil type, hydrology, pests, diseases, or extreme weather events like drought, hail, storms, or floods.
A farmer can use these variability maps to check for anomalies, or they can be used as input for variable-rate fertilization or irrigation to adjust the dose of fertilizer or water according to the spatial variation within the field. The base index for calculating the variability maps is fAPAR, the fraction of absorbed photosynthetically active radiation derived from Sentinel-2 satellite images with a spatial resolution of 10m. For each cloud-free satellite image, we compare each pixel’s fAPAR value to the field’s median fAPAR value (pixel values are expressed as % of the median). The result is a GeoTIFF image showing the deviations.
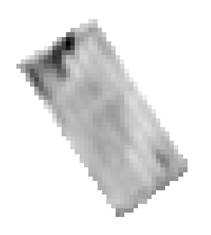
Example of a variability map (single date)
Finally, the deviations are classified into five categories according to their relevance, and color maps are generated.
| Range | Class | Color |
|---|---|---|
| <85% | 1 | red |
| 85-95% | 2 | orange |
| 95-105% | 3 | light green |
| 105-115% | 4 | dark green |
| >115% | 5 | darkest green |
In the red and orange zones, lower fAPAR values are found, while in the green and dark green zones, the fAPAR values are (much) higher than the median value. It is assumed that the crop performs better in the dark green zones than in the orange and red zones.

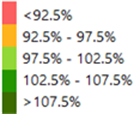
Example of a variability color map (deviations classified into five categories)
Also, the UDP uses the Bio-Physical Parameter (biopar) package to calculate the fAPAR values. The biopar package is a Python package that calculates biophysical parameters from Sentinel-2 satellite images as described here.
A detailed document on the Quality Assessment of the generated products can be found here.